Course Analysis for UK Handicap Races: Track Configurations, Draw Bias and Specialists
Best Greyhound Betting Sites – Bet on Greyhounds in 2026
Loading...
Fifty-Nine Racecourses, Fifty-Nine Puzzles — Why Course Knowledge Sharpens Handicap Picks
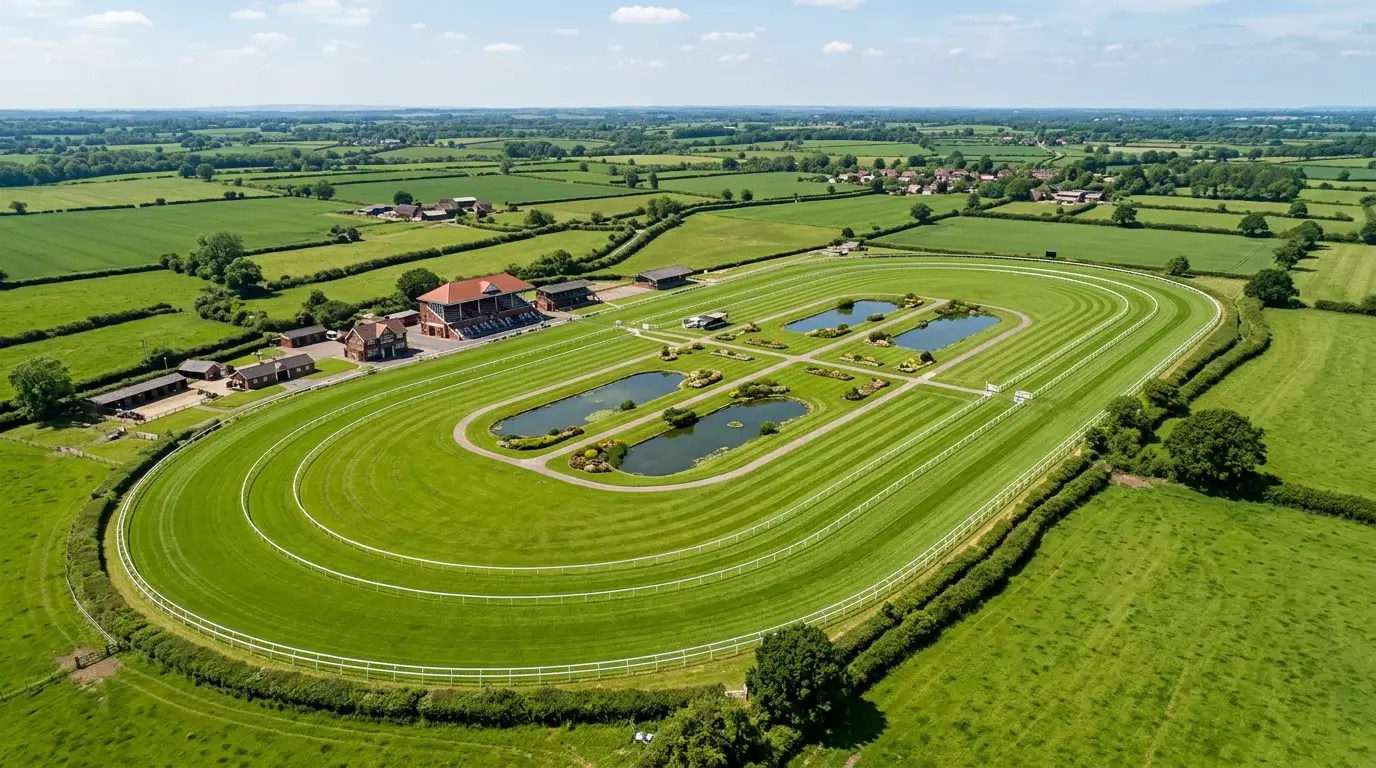
UK horse racing course analysis for handicap purposes begins with a simple geographical fact: Britain has fifty-nine active racecourses, and no two of them ride the same way. Each track has its own configuration — left-handed or right-handed, flat or undulating, sharp turns or sweeping bends, stiff uphill finishes or downhill runs to the line. These characteristics are not cosmetic. They determine which running styles are favoured, which types of horse perform best, and which form lines from other courses are relevant or misleading.
The scale of the challenge reflects the scale of the sport. UK racecourse attendance reached 5.031 million in 2025, spread across those fifty-nine venues, according to the BHA 2025 Racing Report. Each venue hosts a programme calibrated to its own character — Chester’s tight, left-handed circuit favours nimble, front-running types, while Ascot’s stiff, galloping mile sorts the genuinely talented from the merely fast. Know the course, know the contenders. That principle holds across every class and every distance.
For handicap punters, course knowledge is not a luxury — it is a filter that eliminates false contenders and elevates genuine ones. A horse with a perfect record at Newmarket may be a poor bet at Epsom, and the reverse. The BHA rating does not carry a course suffix any more than it carries a going suffix: the number is a general assessment. The punter who applies course context to that general number is working with better information than the one who treats every track as interchangeable.
Track Shapes, Gradients and Going Drainage
British racecourses fall broadly into three shape categories: oval circuits (the majority), figure-of-eight tracks (Windsor, historically Fontwell over hurdles) and straight courses (the Rowley Mile at Newmarket, the July Course at Newmarket, the straight six furlongs at Ascot). Each shape produces different tactical dynamics. On an oval circuit, the bends favour horses racing on the inner — saving ground — while wide runners lose lengths with every turn. On a straight course, there are no bends to save ground on, and the draw or rail position becomes the dominant positional factor.
Gradients vary more dramatically than most punters appreciate. Epsom’s Derby course includes a descent of roughly 130 feet between the top of Tattenham Hill and the winning post, with a pronounced camber on the home turn that throws horses toward the outside rail. Horses that cannot handle the gradient and the camber — those that lose their balance or change their legs awkwardly — are at a persistent disadvantage regardless of their rating. Sandown’s finish involves a stiff uphill climb of about a furlong, which favours strong stayers and punishes horses that have been doing too much too early. Goodwood rises and falls through its entire circuit, producing a unique challenge that rewards course experience above almost everything else.
Going drainage is the hidden variable. Courses built on sandy soil — Newmarket, Newbury — drain quickly and ride faster after rain. Those on clay — Lingfield’s turf course, Huntingdon — hold moisture and can become testing rapidly. A shower that barely affects the going at Newmarket might turn a good-to-firm surface at Huntingdon into good-to-soft within hours. Knowing which courses drain well and which do not allows handicap punters to anticipate going changes before the official declaration is updated — a small informational edge that compounds over a season.
Identifying Track Bias: What Data to Collect
Track bias is a systematic tendency for certain positions — inner rail, outer rail, front of the field, back of the field — to produce disproportionately more winners than probability alone would predict. Biases can be temporary (caused by dolling off, a recently watered strip, or rail movement) or persistent (built into the course’s geometry). Both types are exploitable if identified in time.
The data to collect is straightforward: finishing positions mapped against running position in the race, draw, and rail position. After a day’s racing at a particular course, note whether front-runners or hold-up horses dominated, whether low draws or high draws won the sprint races, and whether the inside or outside rail appeared to ride faster. Over multiple meetings at the same course in the same season, patterns emerge that are reliable enough to act on.
Field size amplifies the impact of track bias. At Premier meetings where fields average 10.97 runners on the Flat, a draw bias has more horses to affect and more data points to confirm or refute the pattern. At Core meetings where fields drop below eight, the bias may still exist but is harder to detect because the sample is smaller and individual horse quality varies more widely. The most reliable bias data comes from big-field handicaps on the Flat, where the field size, the competitive balance and the repeated use of the same configuration provide clean, actionable information.
Temporary biases — those caused by rail movements or selective watering — are particularly valuable because the market is slower to adjust to them. If the rail is moved out by six yards at Haydock, creating fresh ground on the stands’ side, the first race of the day becomes a test of which runners can access that ground. By the third or fourth race, the market has usually absorbed the information, but the early-card handicaps may still be priced on the assumption that the track rides neutrally. Being at the course — or monitoring social media reports from on-course observers — gives a timing advantage that off-course punters rarely enjoy.
Draw Bias on the Flat: Stall Numbers That Win
Draw bias is the single most under-utilised analytical tool in UK Flat handicap betting. At certain courses and distances, the starting stall a horse occupies is a more reliable predictor of performance than its Official Rating. Chester over five and six furlongs produces one of the most extreme biases in British racing: low draws on the inner dominate because the tight, left-handed bends give inside runners an unassailable ground advantage. A horse drawn in stall one at Chester over five furlongs has a statistically significant edge over one drawn in stall twelve, regardless of their relative ratings.
Beverley over five furlongs favours high draws — the opposite of Chester — because the track configuration and camber push the action toward the stands’ rail. At Ascot’s straight course over six furlongs, the stands’ rail often rides faster than the far rail, particularly when the ground is soft on the outer and firmer near the grandstand. At Musselburgh, low draws dominate on sprint distances because the left-handed turn comes early and inside runners save crucial ground.
The practical application is blunt: in a handicap where two horses are equally fancied on form, the one drawn on the favourable side of a biased track is the better bet. The BHA rating does not factor in draw position. The market often does not factor it in either, or factors it in only partially. A horse at 8/1 drawn in stall two at Chester over five furlongs is a fundamentally different proposition from the same horse at the same price drawn in stall fourteen. Course analysis turns an apparently equal choice into a clear one — and that clarity, repeated across a season of Flat handicaps, is the source of a durable, measurable edge.